
Chapter 11
第十一章
Data Transformations
数据转换
By Kiran PV
作者:Kiran PV,译者:Chang
This chapter covers more advanced statistical concepts than some of the others but we wanted to include a brief introduction to data transformations in case you encounter them. If you need to do your own transformation, check out the resources in our Appendix for additional tips.
本章相对其他几章来说,涵盖了一些比较高级的统计概念,但我们还是想要简单介绍一下数据转换,以便大家碰到数据转换的时候觉得不陌生。附录中有更多的数据转换小技巧可供参考。
When you take a digital photo, sometimes the picture comes out in a way that makes certain features hard to see. Maybe the colors are too dark or too light, the photo is blurry, or the objects in the image are too small and you want to zoom in on them. You can pop the photo into something like Instagram or Photoshop, tweak it, apply a filter or two, and transform the picture so it’s much clearer and easier to understand.
我们都有过拍数码照片的经验,有时很难从拍出的照片中看到某些特定的特征。有可能是色彩太暗或者太亮、照片是模糊的、或者照片里的物体太小,需要放大一下才能看清楚。我们可以把照片放到Instagram或者Photoshop进行微调、用一两个滤镜处理一下、再做一下转换,这样可以使照片更清楚、更容易理解。
Sometimes we need to transform data, too. You might get a set of data where, if you visualize it as is, there will be parts that are difficult to see. Also, if you’re going to do statistical testing of your data, many common tests make specific assumptions about the distribution of the data (e.g. that the data are normally distributed). In the real world, we often come across data that don’t meet these assumptions. Data transformations are one way to handle both of these problems. Here, we’ll talk about some of the more common transformations so that when you encounter these terms in the future you’ll have an idea what was done to the data.
有时我们也需要对数据进行转换。我们可能有这样一组数据,如果不作任何处理直接可视化,有些部分很难看清。同时,如果要对数据进行统计检验的话,很多常用的检验方法都会假设数据服从某种特定的分布(比如正态分布)。然而在实际生活中,我们经常碰到不满足这些假设的数据。数据转换可以同时解决上述两种问题。本章中我们会介绍一些比较常见的转换方法,这样读者在后面碰到相关术语的时候,可以对相应的数据处理方式有一个基本的了解。
Data transformations are one of the common manipulation procedures which can reveal features hidden in the data that are not observable in their original form. We can transform the distribution of data to make it easier to see and so that any required assumptions of statistical tests are met. We usually do this by replacing one variable with a mathematical function operating on that variable. For example, you could replace a variable x by the logarithm of x or by square root of x.
数据转换是常见的数据处理方法之一。通过数据转换可以揭示数据中的隐藏特性,这些隐藏特性在数据的原始形态下是没办法观察到的。我们可以对数据的分布进行转换,使其更易于观察,并满足统计检验所需要的所有假设。常用的数据转换方式是变量代换,即用变量的数学函数来替换变量。如,我们可以用变量x的对数或者平方根来替换x.
Never perform the transform directly on your original data! Either create an additional column to hold the new values for each variable you’re transforming or make a copy of your entire dataset.
切忌不要直接对原始数据进行转换!可以创建一个新的列来存放变量转换后得到的新值,或者把整个数据集复制一份。
Normal Distribution and Skewness in Data
正态分布和数据的偏度
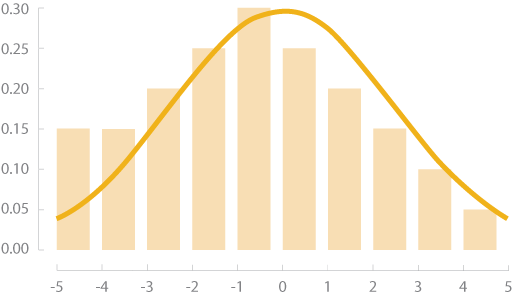
One of the most frequently-encountered assumptions of statistical tests is that data should be normally distributed. You may have heard of the normal distribution referred to as a “bell curve” before; this is because a normal distribution takes the shape of a bell, with the data spread around a central value. Some of the data examples that commonly follow a normal distribution are related to human measurements such as height, weight, life span, and scores on IQ tests.
统计检验中最常碰到的假设是数据服从正态分布。大家以前可能听说过,正态分布被称为“钟形曲线”,这是因为正态分布概率密度曲线的形状像钟一样,所有数据分布在一个中心值的两侧。一些服从正态分布的数据的例子和人的测量数据有关,比如身高、体重、寿命、以及IQ值的分布。
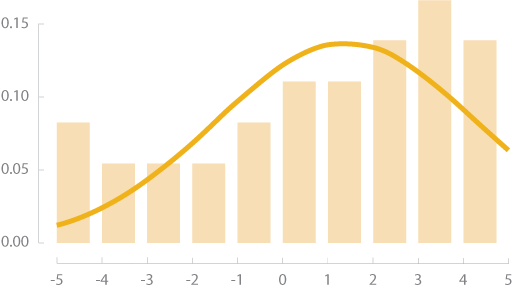
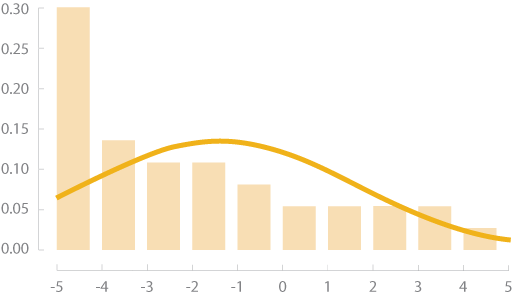
Unlike a normal distribution, which is symmetric around the mean value, skewed data tend to have more observations either to left side or to right side. Right skewed data have a long tail that extends to right whereas left skewed data will have a long tail extending to the left of the mean value. When data are very skewed, it can be hard to see the extreme values in a visualization. If you notice that your data distribution is skewed, you might consider transforming it if you’re doing statistical testing or if the data are difficult to visualize in their original state.
和正态分布以均值为中心对称不同,偏态数据沿均值两侧不对称,而是更多集中于均值的左侧或者右侧。右偏态数据长尾向均值右侧延伸,左偏态数据长尾向均值左侧延伸。当数据的斜度很大时,我们很难在可视化结果中看到极值。如果注意到数据是有偏度的,当需要进行统计检验或者原始数据比较难可视化时,可以考虑进行数据转换。
Normal Distribution
正态分布
Left Skew
左偏态
Right Skew
右偏态
Understanding Transformations Using Sample Data
借助于样本数据来理解转换
Let’s use the population and land area of the 50 US states from 2012 to see how transformations work on actual data. The first step in transformation is to evaluate the distribution of the data. Then you can decide what transformation is appropriate (if one is needed). We can start by constructing a histogram of the population data and a scatterplot of the population-area data to get a better sense of how they’re distributed.
我们以2012年美国50个州各自的人口数量和领土面积为例,看看如何对实际数据进行转换。转换的第一步是评估一下数据的分布。接下来如果有必要的话,判断所需的转换方法。首先创建人口数据直方图和人口数量-领土面积散点图,这样可以更直观的感受数据是如何分布的。
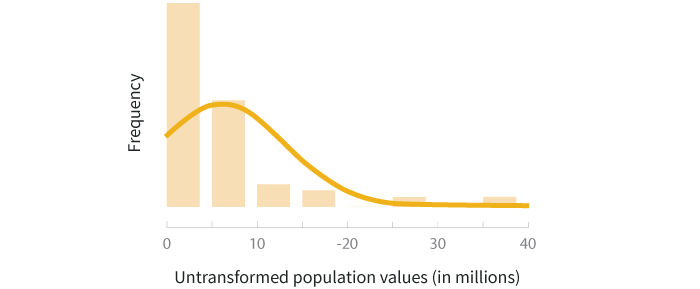
The histogram above shows that the distribution of population values is right skewed. This is reasonable to expect because the majority of states’ populations lie in the range of 1-10 million. If we want to do statistical testing that relies on a normal distribution assumption, these data will need to be transformed.
从上面的直方图可以看出,人口数据服从右偏态分布。由于美国绝大部分州的人口数量在100万到1000万之间,这是一个预料之中的结果。如果想要进行以正态分布为前提假设的统计检验,就需要对这些数据进行转换。
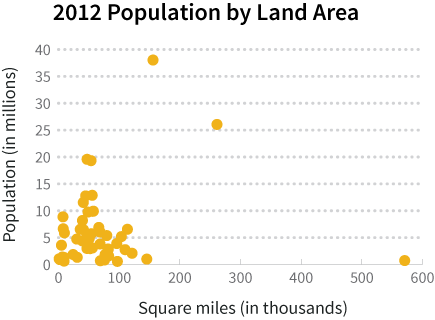
In the scatter plot above, you can see that most of the data points are clustered in the bottom left corner of the graph, making it hard to see how population and land area are related. We can’t just scale the graph differently to “zoom in” on that corner because we’d knock California and Alaska off the chart. We can, however, use transformations to help make the data easier to view.
从上面的散点图中可以看出,大部分数据集中在图的左下角,因此很难看清人口数量和领土面积之间有什么样的关系。简单的对图形进行放缩是不可行的,因为如果要放大左下角的部分,就会把加州(美国人口最多的州)和阿拉斯加州(美国面积最大的州)从图上去掉。但是我们可以通过数据转换来提高数据的易读性。
There are many transformation methods that can be applied in either of these situations, but let’s look at a couple of the common ones to see how they can affect both a visualization and the shape of a distribution.
很多转换方法都适用于以上两组数据。下面我们以一些常见的转换为例,来看看数据转换如何影响到可视化效果和数据分布的形状。
Log Transform
对数转换
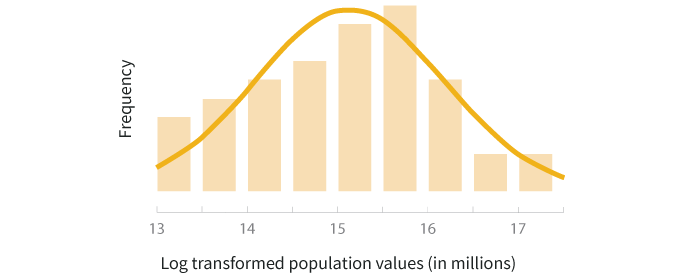
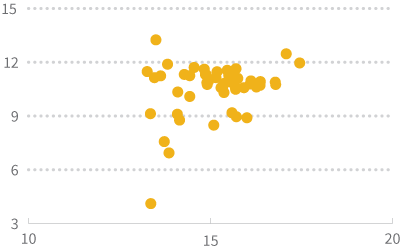
To do a logarithmic transformation, you calculate the log of each value in the dataset and use those transformed values rather than your raw data. Log transforms tend to have a major effect on distribution shape, and in visualizations can bring extreme outliers closer to the rest of the data so graphs aren’t stretched out as much. You can either use natural logs (ln) or logs with base 10. The graphs below show the histogram of population data after a natural log transformation is applied and what the scatterplot looks like if you use a natural log transformation on both the population and land area variables.
要进行对数转换,就要计算数据集中每个值的对数值,后续处理中使用转换后的值,而不是原始值。对数转换对分布形状有极大的影响,同时在数据可视化时,可以将长尾拖近,这样整个图形不会过于延伸。既可以使用自然对数(ln),也可以使用以10为底的对数。下图是对人口数量进行自然对数转换后的数据直方图,以及同时对人口数量和领土面积进行自然对数转换后得到的散点图。
Square Root Transform
平方根转换
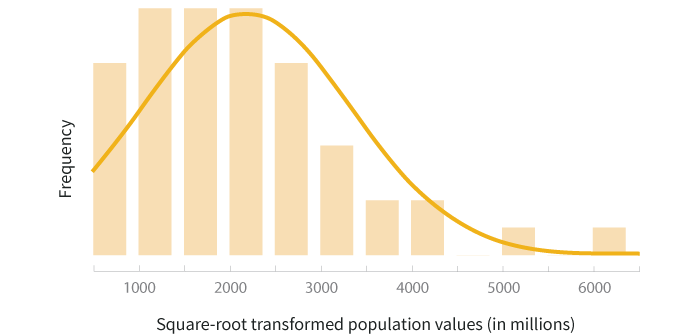
The square root transformation uses the square root of each value instead of the log, and has a more moderate effect on the distribution shape. The two graphs below show the histogram of population data and the scatterplot of population by land area, both after square root transformation is applied .
平方根转换利用的是每个值得平方根,而不是对数值,这种转换对分布的形状有一定的影响。下面的两幅图是对人口数量与领土面积进行平方根转换后,得到的相应的直方图与散点图。

Choosing the Right Transform
如何选择正确的转换
As you develop a better understanding of different transformation methods, you might wonder how to pick between them. The answer to this question is not straightforward and although there are formal statistical methods for selecting a transformation, we often need to use trial-and-error combined with knowledge of different transformations. A general strategy is to apply some of the most frequently used transforms such as log, square root, square, reciprocal, and cube root, and then choose the best one after observing the results.
现在我们已经对不同的数据转换方法有了一定的了解,接下来可能要问到底哪种方法更适合呢?这个问题没有确定的答案。尽管有选择转换方式的正规统计方法, 实际应用中还是要结合各种转换方法的特点,反复试验。通用的策略是分别使用各种常见的转换方法,包括取对数、求平方根、平方、倒数、立方根等,然后观察结果,来确定最适合的转换方法。
Looking at the transformed histograms above, the log transformed data seems to be a better fit to the normal distribution while the square root transformed data still carries the right skew. In this example, if you’re doing a statistical test that has assumes the data are normally distributed, the log transformation would be a better method to use than the square root transformation.
先在我们来看一下上面转换后的直方图,对数转化后的数据看上去可以更好的匹配正态分布,平方根转换后的数据仍然有一定右偏度。此例中,如果要进行以正态分布为前提假设的统计检验,对数转换是更佳选择。
On the other hand, if your primary purpose in the example above is to visualize the relationship between state population and land area, the square root transformation does a better job of spreading out the data and making it easier to view than the log transformation.
另一方面,如果上例中我们的主要目的是可视化州人口数量与领土面积的关系,平方根转换的效果则优于对数转换,因为平方根转换后数据更加分散,因而易读性更好。
Common Transformations
常用转换
| Method | Math Operation | Good for: | Bad for: |
|---|---|---|---|
| Log | ln(x) log10(x) |
Right skewed data log10(x) is especially good at handling higher order powers of 10 (e.g. 1000, 100000) |
Zero values Negative values |
| Square root | √x | Right skewed data | Negative values |
| Square | x2 | Left skewed data | Negative values |
| Cube root | x1/3 | Right skewed data Negative values |
Not as effective at normalizing as log transform |
| Reciprocal | 1/x | Making small values bigger and big values smaller | Zero values Negative values |
| 方法 | 数学运算 | 适合于: | 不适合于: |
|---|---|---|---|
| 取对数 | ln(x) log10(x) |
右偏态数据 log10(x)特别适合处理10的高阶次幂(比如1000,100000) |
零值 负数 |
| 平方根 | √x | 右偏态数据 | 负数 |
| 平方 | x2 | 左偏态数据 | 负数 |
| 立方根 | x1/3 | 右偏态数据 负数 |
在数据归一化方面效果不如对数转换 |
| 取倒数 | 1/x | 使小值变大,大值变小 | 零值 负数 |
Caveats about Transformation
数据转换注意事项
Since data transformation methods involve the application of a mathematical function to your data, you need to be careful when reporting or interpreting any insights derived from the transformed data because a transformation changes the unit of the data. For example, when we apply a logarithmic function to a population variable, the unit of measurement becomes the log of the population. When you’re sharing results, your audience may assume that the calculated numbers or visualizations they’re seeing are based on raw data, so if the values have been transformed, you should clearly communicate what transformation was used, as well as what units the data are being displayed in.
由于数据转换涉及到对数据应用数学函数,在报告或者解释基于转换后的数据得到的结论时,需要特别小心,因为转换改变了数据的单位。例如,在对人口数量变量进行对数操作之后,测量的单位成了人口数量的对数。当我们共享结果的时候,读者可能会以为计算出的数值或者所见到的可视化图形是基于原始数据得到的。因此对于转换后的数值,要明确告知所进行的转换,以及所显示的数据的单位。
If you use transformed data to calculate statistical values like means, you should back-transform the final results and report them in their original units. To back-transform, you just do the opposite of the mathematical function you used in the first place. For example, if you did a square root transformation, you would back-transform by squaring your end result.
如果用转换后的数据来计算均值一类的统计值,需要对计算结果进行反-转换,以数据的原始单位报告结果。进行反-转换的时候,只需要利用最初转换函数的反函数既可。比方说,最初的转换是求平方根,则对最终结果求平方就相当于进行反-转换
You may not see transforms every day, but when you do, it’s helpful to know why they were used and how they affect your data. It’s important to be able to see different parts of the picture when working with data, and transformations give you another tool to help you do just that!
我们可能不会每天都见到数据转换,但一旦碰到的时候,知道为什么使用转换及其对数据的影响对我们很有帮助。当对数据进行操作时,同时看到图片的各个部分是很重要的,数据转换正是这样一种工具。